Create and interpret equations of linear functions
Identify and graph lines that are vertical or horizontal
Graph straight lines by plotting points, using slope and y-intercept, and make changes like shifts to graphs
Write equations for lines that run parallel or at a right angle to another line
Writing and Interpreting an Equation for a Linear Function
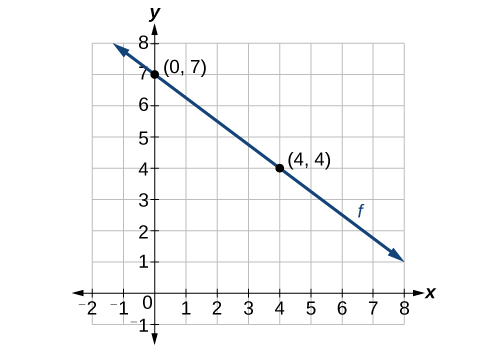
Graph of a linear function with two points labeled
Previously we wrote equations in both the slope-intercept form and the point-slope form. Now we can choose which method to use to write equations for linear functions based on the information we are given. That information may be provided in the form of a graph, a point and a slope, two points, and so on. Look at the graph of the function [latex]f[/latex] given below:
We are not given the slope of the line, but we can choose any two points on the line to find the slope. Let’s choose [latex](0, 7)[/latex] and [latex](4, 4)[/latex].
[latex]\begin{array}{rcl} m & = & \frac{y_2 - y_1}{x_2 - x_1} \\ m & = & \frac{4 - 7}{4 - 0} \\ m & = & -\frac{3}{4} \end{array}[/latex]
Now we can substitute the slope and the coordinates of one of the points into the point-slope form.
If we want to rewrite the equation in the slope-intercept form, we would find
[latex]\begin{array}{rcl} y - 4 & = & -\frac{3}{4}(x - 4) \\ y - 4 & = & -\frac{3}{4}x + 3 \\ y & = & -\frac{3}{4}x + 7 \end{array}[/latex]
If we want to find the slope-intercept form without first writing the point-slope form, we could have recognized that the line crosses the y-axis when the output value is 7. Therefore, [latex]b = 7[/latex]. We now have the initial value [latex]b[/latex] and the slope [latex]m[/latex], so we can substitute [latex]m[/latex] and [latex]b[/latex] into the slope-intercept form of a line.
Substituting values into slope-intercept form
So the function is [latex]f(x) = -\frac{3}{4}x + 7[/latex], and the linear equation would be [latex]y = -\frac{3}{4}x + 7[/latex].
How to: Given the graph of a linear function, write an equation to represent the function.
Identify two points on the line.
Use the two points to calculate the slope.
Determine where the line crosses the y-axis to identify the y-intercept by visual inspection.
Substitute the slope and y-intercept into the slope-intercept form of a line equation.
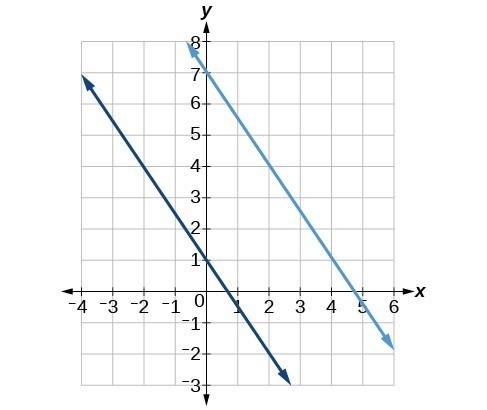
Write the equations of the linear function for the following graphs.
Graph of two linear functions
We can see right away that the graph crosses the [latex]y[/latex]-axis at the point [latex](0,1)[/latex], so, this is the [latex]y[/latex]-intercept. Thus, [latex]b = 1[/latex].
Then we can calculate the slope by finding the rise and run. We can choose any two points:
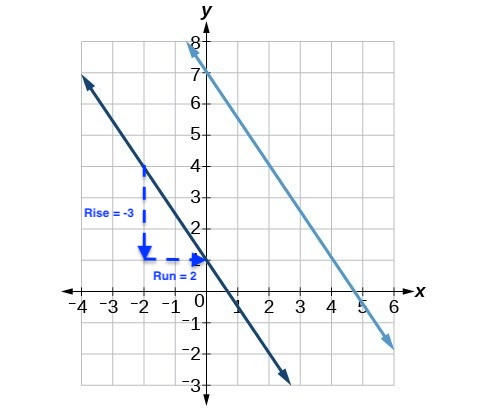
Graph of two linear functions
Thus, the slope is [latex]-\dfrac{3}{2}[/latex].
The equation of the line is [latex]f(x) = -\dfrac{3}{2}x+1[/latex].
We can see right away that the graph crosses the [latex]y[/latex]-axis at the point [latex](0,7)[/latex], so, this is the [latex]y[/latex]-intercept. Thus, [latex]b = 7[/latex].
Two two lines have exactly the same steepness, which means their slopes are identical. Thus, the slope is also [latex]-\dfrac{3}{2}[/latex].
The equation of the line is [latex]f(x) = -\dfrac{3}{2}x+7[/latex].
If [latex]f[/latex] is a linear function, with [latex]f(3) = -2[/latex], and [latex]f(8) = 1[/latex], find an equation for the function in slope-intercept form.
We can use algebra to rewrite the equation in the slope-intercept form.
[latex]\begin{array}{rcl} y + 2 & = & \frac{3}{5}(x - 3) \\ y + 2 & = & \frac{3}{5}x - \frac{9}{5} \\ y & = & \frac{3}{5}x - \frac{19}{5} \end{array}[/latex]
Suppose Ben starts a company in which he incurs a fixed cost of [latex]$1,250[/latex] per month for the overhead, which includes his office rent. His production costs are [latex]$37.50[/latex] per item.
[latex]\\[/latex]
Write a linear function [latex]C(x)[/latex] where [latex]C(x)[/latex] is the cost for [latex]x[/latex] items produced in a given month.
We can analyze Ben’s cost problem using the slope-intercept form [latex]y = mx + b[/latex], where the slope [latex]m[/latex] represents the variable cost per item, and the [latex]y[/latex]-intercept [latex]b[/latex] represents the fixed monthly cost.In this case:
The slope is [latex]37.50[/latex], meaning the cost increases by [latex]$37.50[/latex] for each additional item produced.
The y-intercept is [latex]1250[/latex], which is the fixed cost Ben incurs even when no items are produced.
Thus, the linear function for Ben’s total cost [latex]C(x)[/latex] can be written as:
[latex]C(x) = 37.50x + 1250[/latex]
This equation represents the total monthly cost for producing [latex]x[/latex] items, where the slope reflects the rate of change in cost and the [latex]y[/latex]-intercept reflects the fixed cost.