The slope of a line tells us how steep the line is and which direction it goes. It’s like measuring how much you go up (or down) for every step you take to the right.
[latex](x_1, y_1)[/latex] and [latex](x_2, y_2)[/latex] are two points on the line.
[latex]m[/latex] is the slope of the line.
“rise” is the change in output.
“run” is the change in input.
When interpreting slope, it will be important to consider the units of measurement. Make sure to always attach these units to both the numerator and denominator when they are provided to you.
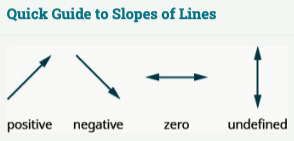
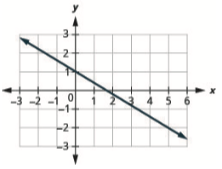
Guide on slopes of linesGraph of a line
Find the slope of the line shown.
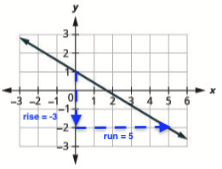
Locate two points on the graph whose coordinates are integers. Label the coordinates of these points.
So, the slope of the line is [latex]-\dfrac{3}{5}[/latex].
It may help to visualize this change as [latex]m =\dfrac{\text{rise}}{\text{run}}[/latex].
Count the rise between the points. Since the line goes down, the slope is negative. Then count the run, or horizontal change.
Graph of a line with slope labels
So, the slope of the line is [latex]m =\dfrac{\text{rise}}{\text{run}} = \dfrac{-3}{5}[/latex].
Find the slope of [latex]2x-4y = 5[/latex].
To find the slope of the line given by the equation [latex]2x-4y = 5[/latex], we need to rewrite the equation in slope-intercept form [latex]y = mx+b[/latex], where [latex]m[/latex] is the slope.