Finding Input and Output Values of a Function
Evaluating a Function Given in Tabular Form
As we have seen in this section, we can represent functions in tables. Conversely, we can use information in tables to write functions, and we can evaluate functions using the tables.
For example, how well do our pets recall the fond memories we share with them? There is an urban legend that a goldfish has a memory of [latex]3[/latex] seconds, but this is just a myth. Goldfish can remember up to [latex]3[/latex] months, while the beta fish has a memory of up to [latex]5[/latex] months. And while a puppy’s memory span is no longer than [latex]30[/latex] seconds, the adult dog can remember for [latex]5[/latex] minutes. This is meager compared to a cat, whose memory span lasts for [latex]16[/latex] hours.
The function that relates the type of pet to the duration of its memory span is more easily visualized with the use of a table. See the table below.
| Pet | Memory span in hours |
|---|---|
| Puppy | [latex]0.008[/latex] |
| Adult dog | [latex]0.083[/latex] |
| Cat | [latex]16[/latex] |
| Goldfish | [latex]2160[/latex] |
| Beta fish | [latex]3600[/latex] |
At times, evaluating a function in table form may be more useful than using equations. Here let us call the function [latex]P[/latex]. The domain of the function is the type of pet and the range is a real number representing the number of hours the pet’s memory span lasts. We can evaluate the function [latex]P[/latex] at the input value of “goldfish.” We would write [latex]P\left(\text{goldfish}\right)=2160[/latex]. Notice that, to evaluate the function in table form, we identify the input value and the corresponding output value from the pertinent row of the table. The tabular form for function [latex]P[/latex] seems ideally suited to this function, more so than writing it in paragraph or function form.
- Find the given input in the row (or column) of input values.
- Identify the corresponding output value paired with that input value.
- Find the given output values in the row (or column) of output values, noting every time that output value appears.
- Identify the input value(s) corresponding to the given output value.
- Evaluate [latex]g\left(3\right)[/latex].
- Solve [latex]g\left(n\right)=6[/latex].
| [latex]n[/latex] | [latex]1[/latex] | [latex]2[/latex] | [latex]3[/latex] | [latex]4[/latex] | [latex]5[/latex] |
| [latex]g(n)[/latex] | [latex]8[/latex] | [latex]6[/latex] | [latex]7[/latex] | [latex]6[/latex] | [latex]8[/latex] |
Finding Function Values from a Graph
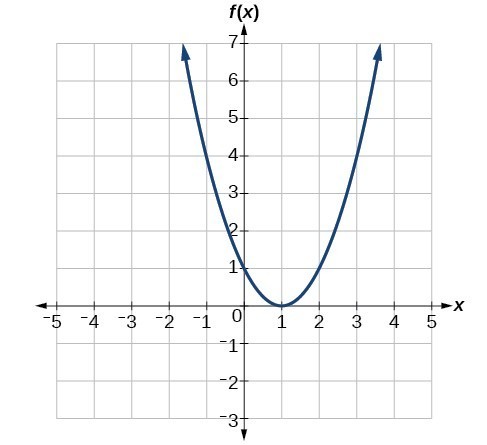
Evaluating a function using a graph also requires finding the corresponding output value for a given input value, only in this case, we find the output value by looking at the graph. Solving a function equation using a graph requires finding all instances of the given output value on the graph and observing the corresponding input value(s).
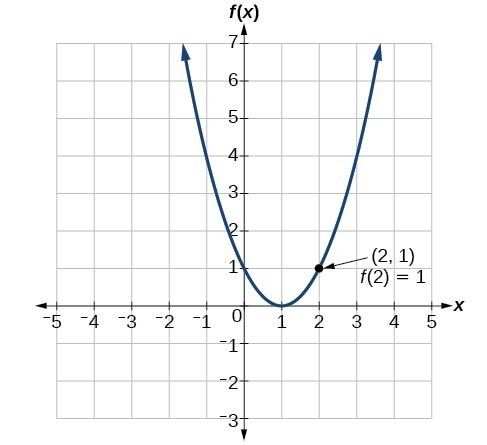
- Evaluate [latex]f\left(2\right)[/latex].
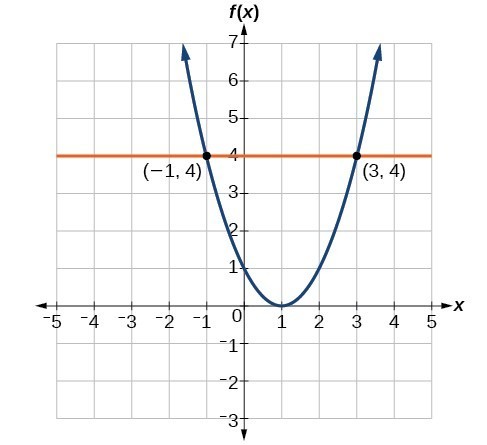
- Solve [latex]f\left(x\right)=4[/latex].
You can view the transcript for “Learn Desmos: Function Notation” here (opens in new window).
Now try the following with an online graphing calculator:
- Graph the function [latex]f(x) = -\frac{1}{2}x^2+x+4[/latex] using function notation.
- Evaluate the function at [latex]x=1[/latex]
- Make a table of values that references the function. Include at least the interval [latex][-5,5][/latex] for [latex]x[/latex]-values.
- Solve the function for [latex]f(0)[/latex]