- Define what a function is and apply the vertical line test to identify functions
- Use function notation to represent and evaluate functions
- Recognize the graphs of fundamental toolkit functions
Determining Whether a Relation Represents a Function
A jetliner changes altitude as its distance from the starting point of a flight increases. The weight of a growing child increases with time. In each case, one quantity depends on another. There is a relationship between the two quantities that we can describe, analyze, and use to make predictions. In this section, we will analyze such relationships.
A relation is a set of ordered pairs. The set of the first components of each ordered pair is called the domain and the set of the second components of each ordered pair is called the range. Note that each value in the domain is also known as an input value, or independent variable, and is often labeled with the lowercase letter [latex]x[/latex] Each value in the range is also known as an output value, or dependent variable, and is often labeled with lowercase letter [latex]y[/latex].
relation, domain, and range
A relation is defined as a set of ordered pairs, where the set of first components is known as the domain and each value in it is an input or independent variable, often labeled [latex]x[/latex]. The set of second components in the ordered pairs is called the range, and each value in the range is an output or dependent variable, often labeled [latex]y[/latex].
Consider the following set of ordered pairs. The first numbers in each pair are the first five natural numbers. The second number in each pair is twice that of the first.
[latex]\{(1,2),(2,4),(3,6),(4,8),(5,10)\}[/latex]
The domain is [latex]\{1,2,3,4,5\}[/latex]. The range is [latex]\{2,4,6,8,10\}[/latex].
A function [latex]f[/latex] is a relation that assigns a single value in the range to each value in the domain. In other words, no [latex]x[/latex]-values are repeated.
function
A function is a specific type of relation where each input value corresponds to one and only one output value. We say “the output is a function of the input.”
In a function:
- The input values make up the domain
- The output values make up the range.
- The input value is called the independent value.
- The output value is called the dependent value because it depends on the input value.
For our example that relates the first five natural numbers to numbers double their values, this relation is a function because each element in the domain, [latex]\{1,2,3,4,5\}[/latex], is paired with exactly one element in the range, [latex]\{2,4,6,8,10\}[/latex].
| Family Member’s Name (Input) | Family Member’s Age (Output) |
|---|---|
| Nellie | [latex]13[/latex] |
| Marcos | [latex]11[/latex] |
| Esther | [latex]46[/latex] |
| Samuel | [latex]47[/latex] |
| Nina | [latex]47[/latex] |
| Paul | [latex]47[/latex] |
| Katrina | [latex]21[/latex] |
| Andrew | [latex]16[/latex] |
| Maria | [latex]13[/latex] |
| Ana | [latex]81[/latex] |
Notice that each name matches with exactly one age. This is an example of a function because each input has a unique output.
Now, compare this with a table where the input is age and the output is name:
| Family Member’s Age (Input) | Family Member’s Name (Output) |
|---|---|
| [latex]11[/latex] | Marcos |
| [latex]13[/latex] | Nellie, Maria |
| [latex]16[/latex] | Andrew |
| [latex]21[/latex] | Katrina |
| [latex]46[/latex] | Esther |
| [latex]47[/latex] | Samuel, Nina, Paul |
| [latex]81[/latex] | Ana |
In this table, some ages correspond to more than one name. This is a relation but not a function because some inputs (ages) have multiple outputs (names).
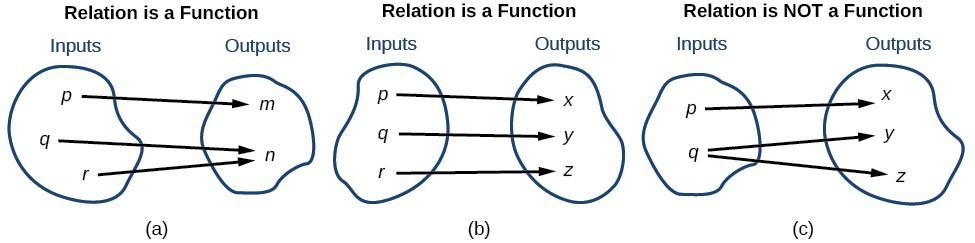
The figure below compares relations that are functions and not functions.
How to: Given a relationship between two quantities, determine whether the relationship is a function.
- Identify the input values.
- Identify the output values.
- If each input value leads to only one output value, classify the relationship as a function. If any input value leads to two or more outputs, do not classify the relationship as a function.
- Is grade point average a function of the percent grade?
- Is the percent grade a function of the grade point average?
| Percent grade | [latex]0–56[/latex] | [latex]57–61[/latex] | [latex]62–66[/latex] | [latex]67–71[/latex] | [latex]72–77[/latex] | [latex]78–86[/latex] | [latex]87–91[/latex] | [latex]92–100[/latex] |
|---|---|---|---|---|---|---|---|---|
| Grade point average | [latex]0.0[/latex] | [latex]1.0[/latex] | [latex]1.5[/latex] | [latex]2.0[/latex] | [latex]2.5[/latex] | [latex]3.0[/latex] | [latex]3.5[/latex] | [latex]4.0[/latex] |