- Calculate and interpret slope
Calculate and Interpret Slope
In the study of linear functions, the concept of slope is essential. The slope measures the rate of change between two variables and is often denoted by [latex]m[/latex]. It represents how much the dependent variable (usually [latex]y[/latex]) changes for a unit change in the independent variable (usually [latex]x[/latex]).
slope
The slope is a measure of the steepness of the line.
- A positive slope indicates an increase in [latex]y[/latex] as [latex]x[/latex] increases, depicting a line rising from left to right.
- A negative slope indicates a decrease in [latex]y[/latex] as [latex]x[/latex] increases, showing a line that falls from left to right.
- A slope of zero means the line is horizontal, indicating no change in [latex]y[/latex] as [latex]x[/latex] varies, and an undefined slope corresponds to a vertical line, where [latex]x[/latex] remains constant despite changes in [latex]y[/latex].
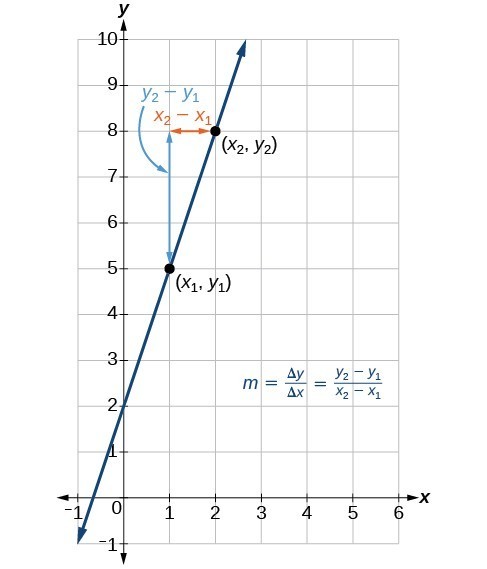
For a linear function defined as [latex]y=f(x)[/latex], where [latex]x[/latex] is the independent variable and [latex]y[/latex] is the dependent variable, the slope [latex]m[/latex] can be calculated when given two distinct points on the line, [latex](x_1,y_1)[/latex] and [latex](x_2,y_2)[/latex]. The slope is given by the ratio of the change in [latex]y[/latex] (the “rise”) to the change in [latex]x[/latex] (the “run”):
[latex]m=\dfrac{\text{change in output (rise)}}{\text{change in input (run)}}=\dfrac{\Delta y}{\Delta x}=\dfrac{{y}_{2}-{y}_{1}}{{x}_{2}-{x}_{1}}[/latex]
where [latex]\Delta y[/latex] is the change in output and [latex]\Delta x[/latex] is the change in input.
Using function notation, if the output values corresponding to [latex]x_1[/latex] and [latex]x_2[/latex] are [latex]f\left({x}_{1}\right)[/latex] and [latex]f\left({x}_{2}\right)[/latex] respectively, the formula for the slope becomes:
[latex]m=\dfrac{f\left({x}_{2}\right)-f\left({x}_{1}\right)}{{x}_{2}-{x}_{1}}[/latex]
The graph below indicates how the slope of the line between the points, [latex]\left({x}_{1,}{y}_{1}\right)[/latex] and [latex]\left({x}_{2,}{y}_{2}\right)[/latex], is calculated.
You’ve just learned that slope is calculated as the change in the vertical distance (rise) divided by the change in the horizontal distance (run). A quick way to remember this is the phrase “Rise Over Run.”
When you’re looking at a graph, you can quickly identify two points and use “Rise Over Run” to calculate the slope right there. To do so pick two points on the line. Count how much you have to go up or down to get from one point to the other—that’s your rise. Then count how much you have to go left or right—that’s your run. The slope is simply the rise divided by the run.
If you go down instead of up, the rise will be negative. If you go left instead of right, the run will be negative. A negative slope means the line is going downhill as you read from left to right.
calculating slope
The slope, or rate of change, [latex]m[/latex], of a function can be calculated according to the following:
[latex]m=\dfrac{\text{change in output (rise)}}{\text{change in input (run)}}=\dfrac{\Delta y}{\Delta x}=\dfrac{{y}_{2}-{y}_{1}}{{x}_{2}-{x}_{1}} \Rightarrow \dfrac{f(x_2)-f(x_1)}{x_2 - x_1}[/latex]
where [latex]{x_1}[/latex] and [latex]x_2[/latex] are input values and [latex]{f(x_1)}[/latex] and [latex]f(x_2)[/latex] are output values.
- Determine the units for output and input values.
- Calculate the change of output values and change of input values.
- Interpret the slope as the change in output values per unit of the input value.
Q&A
Are the units for slope always [latex]\frac{\text{units for the output}}{\text{units for the input}}[/latex] ?
Yes. Think of the units as the change of output value for each unit of change in input value. An example of slope could be miles per hour or dollars per day. Notice the units appear as a ratio of units for the output per units for the input.
When interpreting slope as an average rate of change, it is customary to express the calculation as change in output per unit of input.
A vehicle traveled from mile marker [latex]57[/latex] to mile marker [latex]180[/latex] between 4:15 pm and 6:21 pm.
Can you use the formula for slope to find the vehicle’s average rate of change in distance as a function of the time it traveled?