- Determine whether a linear function is increasing, decreasing, or constant.
Determine Whether a Linear Function is Increasing, Decreasing, or Constant
A linear function may be increasing, decreasing, or constant.
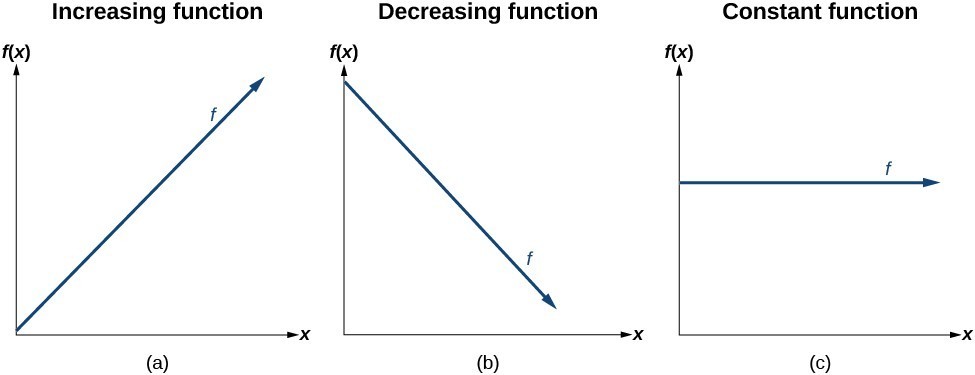
For an increasing function, as with the train example, the output values increase as the input values increase. The graph of an increasing function has a positive slope. A line with a positive slope slants upward from left to right as in Figure 1 (a).
For a decreasing function, the slope is negative. The output values decrease as the input values increase. A line with a negative slope slants downward from left to right as in Figure 1 (b).
If the function is constant, the output values are the same for all input values, so the slope is zero. A line with a slope of zero is horizontal as in Figure 1 (c).
increasing and decreasing linear functions
The slope determines if a linear function function is an increasing, decreasing or constant.
- [latex]f\left(x\right)=mx+b\text{ is an increasing function if }m>0[/latex]
- [latex]f\left(x\right)=mx+b\text{ is an decreasing function if }m<0[/latex]
- [latex]f\left(x\right)=mx+b\text{ is a constant function if }m=0[/latex]
The slope [latex]m[/latex] in the linear function [latex]f(x)=mx+b[/latex] is the rate at which [latex]f(x)[/latex] changes relative to [latex]x[/latex]. It describes both how steep the line is and in which direction it tilts—upwards for a positive slope, downwards for a negative, and horizontal for a slope of zero.
- The total number of texts a teenager sends is considered a function of time in days. The input is the number of days and output is the total number of texts sent.
- A teenager has a limit of [latex]500[/latex] texts per month in his or her data plan. The input is the number of days and output is the total number of texts remaining for the month.
- A teenager has an unlimited number of texts in his or her data plan for a cost of [latex]$50[/latex] per month. The input is the number of days and output is the total cost of texting each month.
Use an online graphing calculator to graph the function: [latex]f(x)=-\frac{2}{3}x-\frac{4}{3}[/latex].
If you are using Desmos, you can add sliders to represent various aspects of your equation. Below is a short tutorial on how to add sliders to your graphs in Desmos. Other online graphing calculators may or may not have this feature.
Try adding a slider to the function [latex]f(x) =-\frac{2}{3}x-\frac{4}{3}[/latex] that will let you change the slope. Limit the range of values for the slope such that your function is increasing, then do the same for a function that is decreasing. Finally, write and graph a function whose slope is constant.