One-Sided and Infinite Limits
One-Sided Limits
After gaining an intuitive understanding of limits and moving to a more rigorous definition, we now revisit one-sided limits. We modify the epsilon-delta definition of a limit to give formal definitions for limits from the right and left at a point. These definitions only require slight modifications from the standard limit definition. In the definition of the limit from the right, the inequality [latex]0 < x-a < \delta[/latex] replaces [latex]0 < |x-a| < \delta[/latex], which ensures that we only consider values of [latex]x[/latex] that are greater than (to the right of) [latex]a[/latex]. Similarly, in the definition of the limit from the left, the inequality [latex]-\delta < x-a < 0[/latex] replaces [latex]0 < |x-a| < \delta[/latex], which ensures that we only consider values of [latex]x[/latex] that are less than (to the left of) [latex]a[/latex].
one-sided limits definitions
Limit from the Right: Let [latex]f(x)[/latex] be defined over an open interval of the form [latex](a,b)[/latex] where [latex]a < b[/latex]. Then,
if for every [latex]\varepsilon >0[/latex], there exists a [latex]\delta >0[/latex] such that if [latex]0 < x-a < \delta[/latex], then [latex]|f(x)-L|<\varepsilon[/latex].
Limit from the Left: Let [latex]f(x)[/latex] be defined over an open interval of the form [latex](a,b)[/latex] where [latex]a < b[/latex]. Then,
if for every [latex]\varepsilon >0[/latex], there exists a [latex]\delta >0[/latex] such that if [latex]0 < b-x < \delta[/latex], then [latex]|f(x)-L|<\varepsilon[/latex].
Prove that [latex]\underset{x\to 4^+}{\lim}\sqrt{x-4}=0[/latex].
Infinite Limits
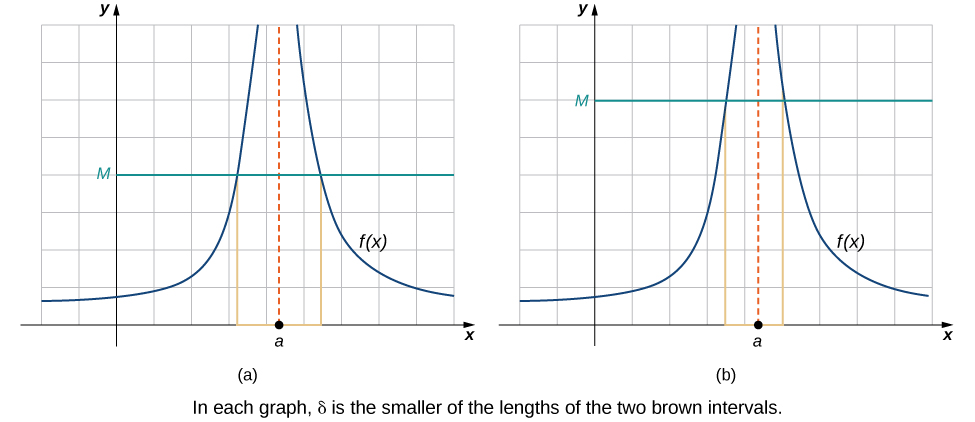
To understand infinite limits, we look at how functions behave as [latex]x[/latex] approaches a certain value [latex]a[/latex]. For [latex]\underset{x\to a}{\lim}f(x)=+\infty[/latex], we want [latex]f(x)[/latex] to get arbitrarily large as [latex]x[/latex] approaches [latex]a[/latex]. Instead of the requirement that [latex]|f(x)-L|<\varepsilon[/latex] for arbitrarily small [latex]\varepsilon[/latex] when [latex]0<|x-a|<\delta[/latex] for small enough [latex]\delta[/latex], we want [latex]f(x)>M[/latex] for arbitrarily large positive [latex]M[/latex] when [latex]0<|x-a|<\delta[/latex] for small enough [latex]\delta[/latex]. The figure below illustrates this idea by showing the value of [latex]\delta[/latex] for successively larger values of [latex]M[/latex].
infinite limit definition
Let [latex]f(x)[/latex] be defined for all [latex]x\ne a[/latex] in an open interval containing [latex]a[/latex]. Then, we have an infinite limit
if for every [latex]M>0[/latex], there exists [latex]\delta >0[/latex] such that if [latex]0<|x-a|<\delta[/latex], then [latex]f(x)>M[/latex].
Let [latex]f(x)[/latex] be defined for all [latex]x\ne a[/latex] in an open interval containing [latex]a[/latex]. Then, we have a negative infinite limit
if for every [latex]M>0[/latex], there exists [latex]\delta >0[/latex] such that if [latex]0<|x-a|<\delta[/latex], then [latex]f(x)<−M[/latex].