Symmetry of Functions
Function graphs often exhibit symmetry, a feature that can simplify understanding their behavior.
Symmetry about the [latex]y[/latex]-axis means that mirroring the graph over the [latex]y[/latex]-axis results in the same graph, indicating an even function where [latex]f(x)=f(−x)[/latex]. For instance, [latex]f(x)=x^4−2x^2−3[/latex] is even because both sides of the [latex]y[/latex]-axis mirror each other.
Symmetry about the origin implies that rotating the graph [latex]180[/latex] degrees around the origin leaves the graph unchanged. This is characteristic of odd functions, satisfying [latex]f(−x)=−f(x)[/latex]. Take [latex]f(x)=x^3−4x[/latex] as an example; it’s odd because rotating its graph doesn’t alter it.
Algebraically, you can check for y-axis symmetry by seeing if [latex]f(−x)[/latex] equals [latex]f(x)[/latex], and for origin symmetry by checking if [latex]f(−x)[/latex] equals [latex]−f(x)[/latex].
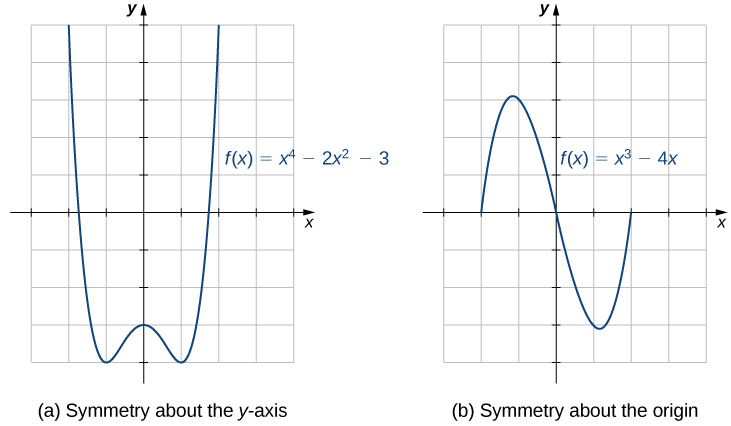
Figure 13. (a) A graph that is symmetric about the [latex]y[/latex]-axis. (b) A graph that is symmetric about the origin.
If we are given the graph of a function, it is easy to see whether the graph has one of these symmetry properties. But without a graph, how can we determine algebraically whether a function [latex]f[/latex] has symmetry? It becomes straightforward to identify symmetry in functions once we determine if they are even or odd. Even functions are symmetric about the y-axis, whereas odd functions exhibit symmetry about the origin.
even and odd functions
- If [latex]f(-x)=f(x)[/latex] for all [latex]x[/latex] in the domain of [latex]f[/latex], then [latex]f[/latex] is an even function. An even function is symmetric about the [latex]y[/latex]-axis.
- If [latex]f(−x)=−f(x)[/latex] for all [latex]x[/latex] in the domain of [latex]f[/latex], then [latex]f[/latex] is an odd function. An odd function is symmetric about the origin.
Determine whether each of the following functions is even, odd, or neither.
- [latex]f(x)=-5x^4+7x^2-2[/latex]
- [latex]f(x)=2x^5-4x+5[/latex]
- [latex]f(x)=\dfrac{3x}{x^2+1}[/latex]
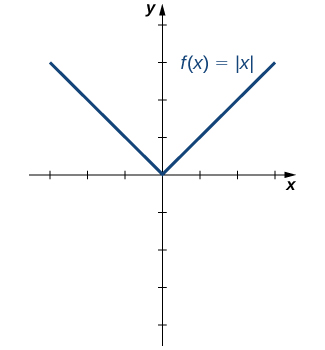
Absolute Value Function
One symmetric function that arises frequently is the absolute value function, written as [latex]|x|[/latex]. The absolute value function is defined as
Some students describe this function by stating that it “makes everything positive.” By the definition of the absolute value function, we see that if [latex]x<0[/latex], then [latex]|x|=−x>0[/latex], and if [latex]x>0[/latex], then [latex]|x|=x>0[/latex]. However, for [latex]x=0, \, |x|=0[/latex]. Therefore, it is more accurate to say that for all nonzero inputs, the output is positive, but if [latex]x=0[/latex], the output [latex]|x|=0[/latex]. We can conclude that the range of the absolute value function is [latex]\{y|y\ge 0\}[/latex].
In Figure 14, we see that the absolute value function is symmetric about the [latex]y[/latex]-axis and is therefore an even function.
Find the domain and range of the function [latex]f(x)=2|x-3|+4[/latex].