Trigonometric Functions
- [latex]\frac{4\pi}{3}[/latex] rad
- [latex]\frac{−\pi }{3}[/latex] rad
- [latex]\frac{11\pi}{6}[/latex] rad
- [latex]210°[/latex]
- [latex]-540°[/latex]
- [latex]-1/2[/latex]
- [latex]-\large\frac{\sqrt{2}}{2}[/latex]
- [latex]\large \frac{\sqrt{3}-1}{2\sqrt{2}} \normalsize = \large \frac{\sqrt{6}-\sqrt{2}}{4}[/latex]
- [latex]b=5.7[/latex]
- [latex]\sin A=\frac{4}{7}, \, \cos A=\frac{5.7}{7}, \, \tan A=\frac{4}{5.7}, \, \csc A=\frac{7}{4}, \, \sec A=\frac{7}{5.7}, \, \cot A=\frac{5.7}{4}[/latex]
- [latex]c=151.7[/latex]
- [latex]\sin A=0.5623, \, \cos A=0.8273, \, \tan A=0.6797, \, \csc A=1.778, \, \sec A=1.209, \, \cot A=1.471[/latex]
- [latex]c=85[/latex]
- [latex]\sin A=\frac{84}{85}, \, \cos A=\frac{13}{85}, \, \tan A=\frac{84}{13}, \, \csc A=\frac{85}{84}, \, \sec A=\frac{85}{13}, \, \cot A=\frac{13}{84}[/latex]
- [latex]y=\frac{24}{25}[/latex]
- [latex]\sin \theta =\frac{24}{25}, \, \cos \theta =\frac{7}{25}, \, \tan \theta =\frac{24}{7}, \, \csc \theta =\frac{25}{24}, \, \sec \theta =\frac{25}{7}, \, \cot \theta =\frac{7}{24}[/latex]
- [latex]x=\frac{−\sqrt{2}}{3}[/latex]
- [latex]\sin \theta =\frac{\sqrt{7}}{3}, \, \cos \theta =\frac{−\sqrt{2}}{3}, \, \tan \theta =\frac{−\sqrt{14}}{2}, \, \csc \theta =\frac{3\sqrt{7}}{7}, \, \sec \theta =\frac{-3\sqrt{2}}{2}, \, \cot \theta =\frac{−\sqrt{14}}{7}[/latex]
- [latex]\sec^2 x[/latex]
- [latex]\sin^2 x[/latex]
- [latex]\sec^2 \theta[/latex]
- [[latex]\large\frac{1}{\sin t} \normalsize =\csc t[/latex]
- [[latex]\theta = \{\frac{\pi}{6}, \, \frac{5\pi}{6}\}[/latex]
- [latex]\theta = \{\frac{\pi}{4}, \, \frac{3\pi}{4}, \, \frac{5\pi}{4}, \, \frac{7\pi}{4}\}[/latex]
- [latex]\theta = \{\frac{2\pi}{3}, \, \frac{5\pi}{3}\}[/latex]
- [latex]\theta = \{0, \, \pi, \, \frac{\pi}{3}, \, \frac{5\pi}{3}\}[/latex]
- [latex]y=4\sin\Big(\large\frac{\pi}{4} \normalsize x\Big)[/latex]
- [latex]y=\cos(2\pi x)[/latex]
- [latex]1[/latex]
- [latex]2\pi[/latex]
- [latex]\frac{\pi}{4}[/latex] units to the right
- [latex]\frac{1}{2}[/latex]
- [latex]8\pi[/latex]
- No phase shift
- [latex]3[/latex]
- [latex]2[/latex]
- [latex]\frac{2}{\pi}[/latex] units to the left
- Approximately [latex]42[/latex] in.
- [latex]0.550[/latex] rad/sec
- [latex]0.236[/latex] rad/sec
- [latex]0.698[/latex] rad/min
- [latex]1.697[/latex] rad/min
- [latex]\approx 30.9 \, \text{in}^2[/latex]
- [latex]\pi /184[/latex]; the voltage repeats every [latex]\pi /184[/latex] sec
- Approximately [latex]59[/latex] periods
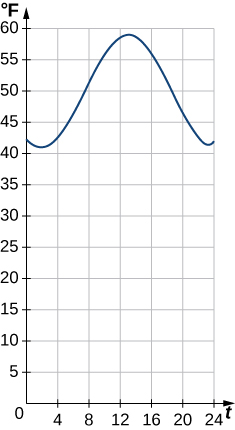
- Amplitude = [latex]10[/latex]; period = [latex]24[/latex]
- [latex]47.4^{\circ} F[/latex]
- [latex]14[/latex] hours later, or 2 p.m.
Inverse Functions
-
-
Not one-to-one
-
Not one-to-one
-
One-to-one
-
- [latex]f^{-1}(x)=\sqrt{x+4}[/latex]
-
Domain: [latex]x \ge -4[/latex], Range: [latex]y \ge 0[/latex]
-
- [latex]f^{-1}(x)=\sqrt[3]{x-1}[/latex]
-
Domain: all real numbers, Range: all real numbers
-
- [latex]f^{-1}(x)=x^2+1[/latex]
-
Domain: [latex]x \ge 0[/latex], Range: [latex]y \ge 1[/latex]
-
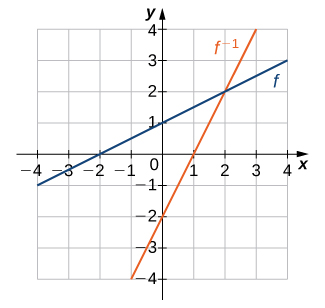
These are inverses.
-
These are not inverses.
-
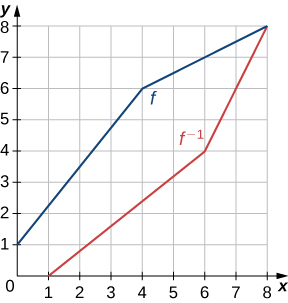
These are inverses.
-
These are inverses.
- [latex]\frac{\pi}{6}[/latex]
- [latex]\frac{\pi}{4}[/latex]
- [latex]\frac{\pi}{6}[/latex]
- [latex]\frac{\sqrt{2}}{2}[/latex]
- [latex]-\frac{\pi}{6}[/latex]
-
- [latex]x=f^{-1}(V)=\sqrt{0.04-\frac{V}{500}}[/latex]
-
The inverse function determines the distance from the center of the artery at which blood is flowing with velocity [latex]V[/latex].
-
[latex]0.1[/latex] cm; [latex]0.14[/latex] cm; [latex]0.17[/latex] cm
-
- [latex]$31,250, $66,667, $107,143[/latex]
- [latex]p=\frac{85C}{C+75}[/latex]
-
[latex]34[/latex] ppb
-
- [latex]~92^{\circ}[/latex]
- [latex]~42^{\circ}[/latex]
- [latex]~27^{\circ}[/latex]
-
[latex]x \approx 6.69, 8.51[/latex]; so, the temperature occurs on June 21 and August 15
- [latex]~1.5 sec[/latex]
-
[latex]\tan^{-1}(\tan(2.1))\approx -1.0416[/latex]; the expression does not equal [latex]2.1[/latex] since [latex]2.1>1.57=\frac{\pi}{2}[/latex]—in other words, it is not in the restricted domain of [latex]\tan x[/latex]. [latex]\cos^{-1}(\cos(2.1))=2.1[/latex], since [latex]2.1[/latex] is in the restricted domain of [latex]\cos x[/latex].
Exponential and Logarithmic Functions
-
- [latex]125[/latex]
- [latex]2.24[/latex]
- [latex]9.74[/latex]
-
- [latex]0.01[/latex]
- [latex]10,000[/latex]
- [latex]46.42[/latex]
- b
- a
- c
-
Domain: all real numbers, Range: [latex](2,\infty)[/latex], Horizontal asymptote at [latex]y=2[/latex]
-
Domain: all real numbers, Range: [latex](0,\infty)[/latex], Horizontal asymptote at [latex]y=0[/latex]
-
Domain: all real numbers, Range: [latex](-\infty ,1)[/latex], Horizontal asymptote at [latex]y=1[/latex]
-
Domain: all real numbers, Range: [latex](-1,\infty )[/latex], Horizontal asymptote at [latex]y=-1[/latex]
- [latex]8^{1/3}=2[/latex]
- [latex]5^2=25[/latex]
- [latex]e^{-3}=\frac{1}{e^3}[/latex]
- [latex]e^0=1[/latex]
- [latex]\log_4(\frac{1}{16})=-2[/latex]
- [latex]\log_9 1=0[/latex]
- [latex]\log_{64} 4=\frac{1}{3}[/latex]
- [latex]\log_9 150=y[/latex]
- [latex]\log_4 0.125=-\frac{3}{2}[/latex]
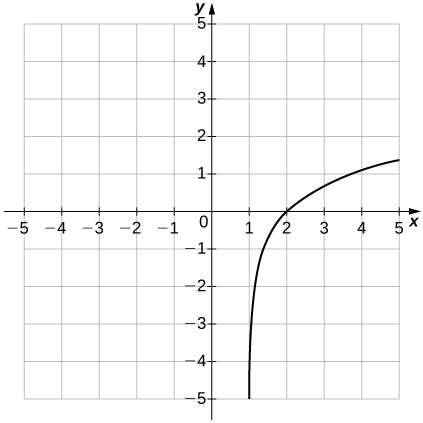
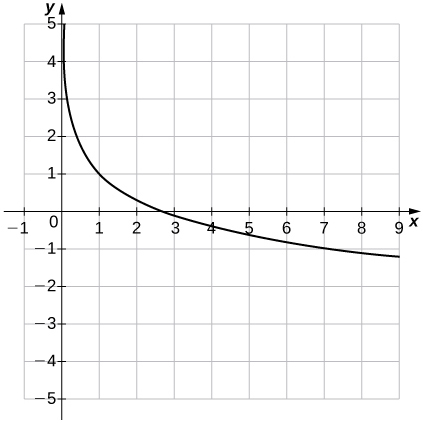
Domain: [latex](1,\infty )[/latex], Range: [latex](−\infty ,\infty)[/latex], Vertical asymptote at [latex]x=1[/latex]
Domain: [latex](0,\infty)[/latex], Range: [latex](−\infty ,\infty)[/latex], Vertical asymptote at [latex]x=0[/latex]
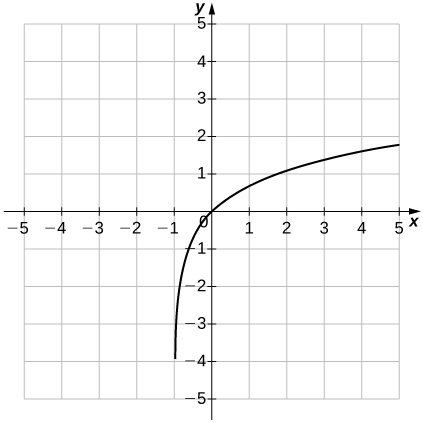
Domain: [latex](-1,\infty)[/latex], Range: [latex](−\infty ,\infty)[/latex], Vertical asymptote at [latex]x=-1[/latex]
- [latex]2+3\log_3 a-\log_3 b[/latex]
- [latex]\frac{3}{2}+\frac{1}{2}\log_5 x+\frac{3}{2}\log_5 y[/latex]
- [latex]-\frac{3}{2}+\ln 6[/latex]
- [latex]\frac{\ln 15}{3}[/latex]
- [latex]\frac{3}{2}[/latex]
- [latex]\log 7.21[/latex]
- [latex]\frac{2}{3}+\frac{\log 11}{3\log 7}[/latex]
- [latex]x=\frac{1}{25}[/latex]
- [latex]x=4[/latex]
- [latex]x=3[/latex]
- [latex]1+\sqrt{5}[/latex]
- [latex]\frac{\ln 82}{\ln 7} \approx 2.2646[/latex]
- [latex]\frac{\ln 211}{\ln 0.5} \approx -7.7211[/latex]
- [latex]\frac{\ln 0.452}{\ln 0.2} \approx 0.4934[/latex]
- [latex]\approx 17,491[/latex]
-
Approximately [latex]$131,653[/latex] is accumulated in [latex]5[/latex] years.
-
a. [latex]\approx 333[/latex] million b. [latex]94[/latex] years from 2013, or in 2107
-
-
a. [latex]k \approx 0.0578[/latex]
-
b. [latex]\approx 92[/latex] hours
-
-
The San Francisco earthquake had [latex]10^{3.4}[/latex] or [latex]\approx 2512[/latex] times more energy than the Japan earthquake.
-