Center of Mass of a Region Bounded by Two Functions
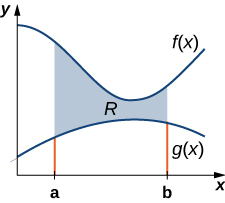
We can extend our approach to find centroids of more complex regions. Suppose our region is bounded above by the graph of a continuous function [latex]f(x)[/latex] and below by a second continuous function [latex]g(x)[/latex], as shown in the figure.
Again, we partition the interval [latex]\left[a,b\right][/latex] and construct rectangles. A representative rectangle is shown in the following figure.
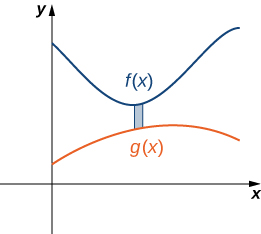
The centroid of each rectangle is:
[latex]({x}_{i}^{*},\frac{f({x}_{i}^{*})+g({x}_{i}^{*})}{2}).[/latex]
In the development of the formulas for the mass of the lamina and the moment with respect to the [latex]y[/latex]-axis, the height of each rectangle is [latex]f(x)−g(x)[/latex]. For the [latex]x[/latex]-axis moment, multiply the area by the distance of the centroid from the [latex]x[/latex]-axis.
Summarizing these findings, we arrive at the following theorem.
center of mass of a lamina bounded by two functions
Let [latex]R[/latex] denote a region bounded above by the graph of a continuous function [latex]f(x),[/latex] below by the graph of the continuous function [latex]g(x),[/latex] and on the left and right by the lines [latex]x=a[/latex] and [latex]x=b,[/latex] respectively. Let [latex]\rho[/latex] denote the density of the associated lamina. Then we can make the following statements:
- The mass of the lamina is
[latex]m=\rho {\displaystyle\int }_{a}^{b}\left[f(x)-g(x)\right]dx.[/latex]
- The moments [latex]{M}_{x}[/latex] and [latex]{M}_{y}[/latex] of the lamina with respect to the [latex]x[/latex]– and [latex]y[/latex]-axes, respectively, are
[latex]{M}_{x}=\rho {\displaystyle\int }_{a}^{b}\frac{1}{2}({\left[f(x)\right]}^{2}-{\left[g(x)\right]}^{2})dx\text{ and }{M}_{y}=\rho {\displaystyle\int }_{a}^{b}x\left[f(x)-g(x)\right]dx.[/latex]
- The coordinates of the center of mass [latex](\overline{x},\overline{y})[/latex] are
[latex]\overline{x}=\frac{{M}_{y}}{m}\text{ and }\overline{y}=\frac{{M}_{x}}{m}.[/latex]
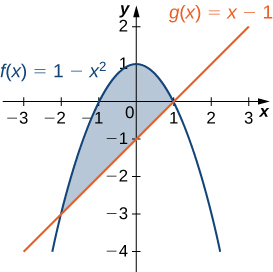
Let [latex]R[/latex] be the region bounded above by the graph of the function [latex]f(x)=1-{x}^{2}[/latex] and below by the graph of the function [latex]g(x)=x-1.[/latex] Find the centroid of the region.