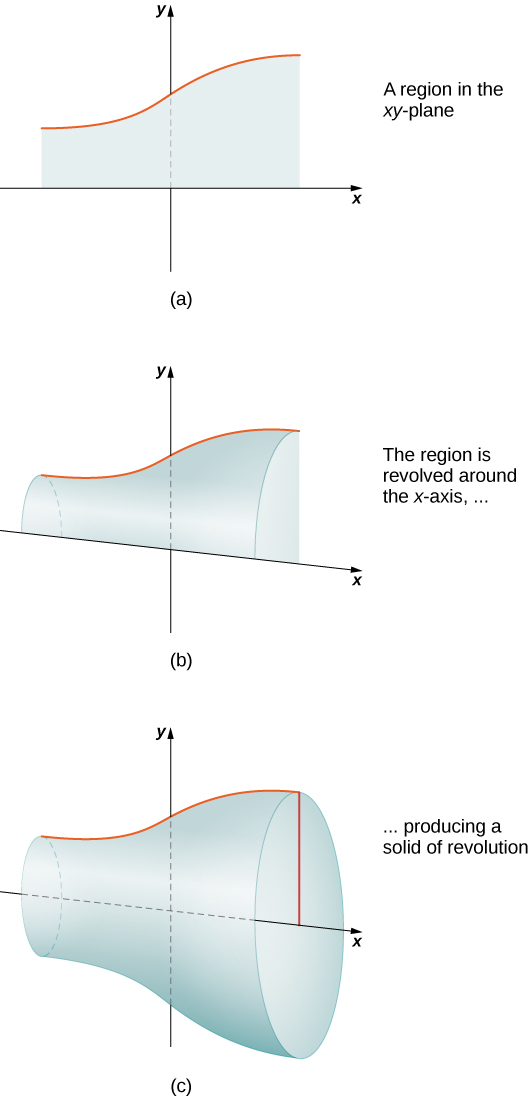
If a region in a plane is revolved around a line in that plane, the resulting solid is called a solid of revolution.
Figure 5. (a) This is the region that is revolved around the x-axis. (b) As the region begins to revolve around the axis, it sweeps out a solid of revolution. (c) This is the solid that results when the revolution is complete.
Solids of revolution are common in mechanical applications, such as machine parts produced by a lathe. We spend the rest of this section looking at solids of this type.
The next example uses the slicing method to calculate the volume of a solid of revolution.
Use the slicing method to find the volume of the solid of revolution bounded by the graphs of [latex]f(x)={x}^{2}-4x+5,x=1,\text{ and }x=4,[/latex] and rotated about the [latex]x\text{-axis}\text{.}[/latex]
Using the problem-solving strategy, we first sketch the graph of the quadratic function over the interval [latex]\left[1,4\right][/latex] as shown in the following figure.
Figure 6. A region used to produce a solid of revolution.
Next, revolve the region around the [latex]x[/latex]-axis, as shown in the following figure.
Figure 7. Two views, (a) and (b), of the solid of revolution produced by revolving the region in (Figure) about the [latex]x\text{-axis}\text{.}[/latex]
Since the solid was formed by revolving the region around the [latex]x\text{-axis,}[/latex] the cross-sections are circles (step 1). The area of the cross-section, then, is the area of a circle, and the radius of the circle is given by [latex]f(x).[/latex]
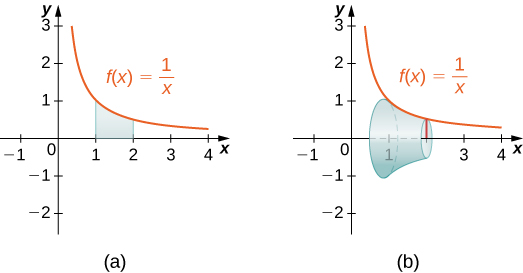
Use the method of slicing to find the volume of the solid of revolution formed by revolving the region between the graph of the function [latex]f(x)=\frac{1}{x}[/latex] and the [latex]x\text{-axis}[/latex] over the interval [latex]\left[1,2\right][/latex] around the [latex]x\text{-axis}\text{.}[/latex] See the following figure.
Figure 8. Graph of f(x) sliced and revolved around the x-axis
[latex]\frac{\pi }{2}[/latex]
Watch the following video to see the worked solution to this example.
For closed captioning, open the video on its original page by clicking the Youtube logo in the lower right-hand corner of the video display. In YouTube, the video will begin at the same starting point as this clip, but will continue playing until the very end.