Skip to content
Basic Functions and Graphs: Get Stronger Answer Key
Review of Functions
Domain = [latex]\{-3,-2,-1,0,1,2,3\}[/latex], range = [latex]\{0,1,4,9\}[/latex]
Yes, a function
Domain = [latex]\{0,1,2,3\}[/latex], range = [latex]\{-3,-2,-1,0,1,2,3\}[/latex]
No, not a function
Domain = [latex]\{3,5,8,10,15,21,33\}[/latex], range = [latex]\{0,1,2,3\}[/latex]
Yes, a function
[latex]-2[/latex]
[latex]3[/latex]
[latex]13[/latex]
[latex]-5x-2[/latex]
[latex]5a-2[/latex]
[latex]5a+5h-2[/latex]
Undefined
[latex]2[/latex]
[latex]\frac{2}{3}[/latex]
[latex]-\frac{2}{x}[/latex]
[latex]\frac{2}{a}[/latex]
[latex]\frac{2}{a+h}[/latex]
[latex]\sqrt{5}[/latex]
[latex]\sqrt{11}[/latex]
[latex]\sqrt{23}[/latex]
[latex]\sqrt{-6x+5}[/latex]
[latex]\sqrt{6a+5}[/latex]
[latex]\sqrt{6a+6h+5}[/latex]
[latex]9[/latex]
[latex]9[/latex]
[latex]9[/latex]
[latex]9[/latex]
[latex]9[/latex]
Domain: [latex]x\ge \frac{1}{8}[/latex]; Range: [latex]y\ge 0[/latex]; Zeros: [latex]x=\frac{1}{8}[/latex]; no [latex]y[/latex]-intercepts
Domain: [latex]x\ge -2[/latex]; Range: [latex]y\ge -1[/latex]; Zeros: [latex]x=-1[/latex]; [latex]y[/latex]-intercepts: [latex]y=-1+\sqrt{2}[/latex]
Domain: [latex]x\ne 4[/latex]; Range: [latex]y\ne 0[/latex]; no [latex]x[/latex]-intercept; [latex]y[/latex]-intercept: [latex]y=-\frac{3}{4}[/latex]
Domain: [latex]x>5[/latex]; Range: [latex]y>0[/latex]; no intercepts
[latex]x[/latex]
[latex]y[/latex]
[latex]x[/latex]
[latex]y[/latex]
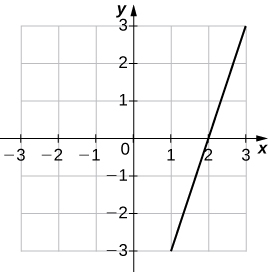
[latex]−3[/latex]
[latex]−15[/latex]
[latex]1[/latex]
[latex]−3[/latex]
[latex]−2[/latex]
[latex]−12[/latex]
[latex]2[/latex]
[latex]0[/latex]
[latex]−1[/latex]
[latex]−9[/latex]
[latex]3[/latex]
[latex]3[/latex]
[latex]0[/latex]
[latex]−6[/latex]
[latex]x[/latex]
[latex]y[/latex]
[latex]x[/latex]
[latex]y[/latex]
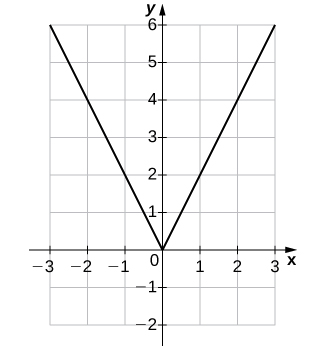
[latex]−3[/latex]
[latex]6[/latex]
[latex]1[/latex]
[latex]2[/latex]
[latex]−2[/latex]
[latex]4[/latex]
[latex]2[/latex]
[latex]4[/latex]
[latex]−1[/latex]
[latex]2[/latex]
[latex]3[/latex]
[latex]6[/latex]
[latex]0[/latex]
[latex]0[/latex]
[latex]x[/latex]
[latex]y[/latex]
[latex]x[/latex]
[latex]y[/latex]
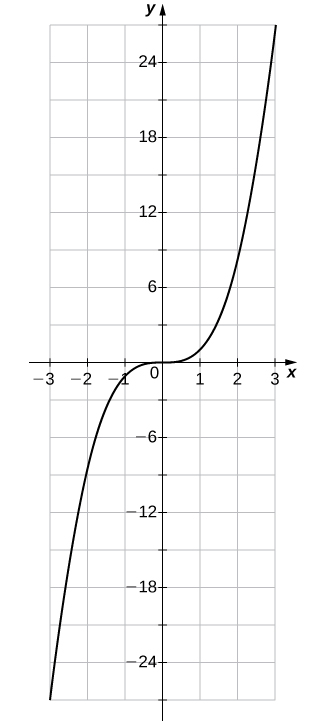
[latex]−3[/latex]
[latex]−27[/latex]
[latex]1[/latex]
[latex]1[/latex]
[latex]−2[/latex]
[latex]−8[/latex]
[latex]2[/latex]
[latex]8[/latex]
[latex]−1[/latex]
[latex]−1[/latex]
[latex]3[/latex]
[latex]27[/latex]
[latex]0[/latex]
[latex]0[/latex]
Function
Domain: all real numbers, Range: [latex]y\ge 0[/latex]
[latex]x=±1[/latex]
[latex]y=1[/latex]
[latex]-1 < x< 0[/latex] and [latex]1 < x < \infty[/latex]
[latex]−\infty < x < -1[/latex] and [latex]0 < x < 1[/latex]
Not constant
[latex]y[/latex]-axis
Even
Function
Domain: all real numbers, Range: [latex]-1.5\le y\le 1.5[/latex]
[latex]x=0[/latex]
[latex]y=0[/latex]
All real numbers
None
Not constant
Origin
Odd
Function
Domain: [latex]−\infty > x > \infty[/latex], Range: [latex]-2\le y\le 2[/latex]
[latex]x=0[/latex]
[latex]y=0[/latex]
[latex]-2 > x > 2[/latex]
Not decreasing
[latex]−\infty > x > -2[/latex] and [latex]2 > x > \infty[/latex]
Origin
Odd
Function
Domain: [latex]-4\le x\le 4[/latex], Range: [latex]-4\le y\le 4[/latex]
[latex]x=1.2[/latex]
[latex]y=4[/latex]
Not increasing
[latex]0 > x > 4[/latex]
[latex]-4 > x > 0[/latex]
No Symmetry
Neither
[latex]5x^2+x-8[/latex]; all real numbers
[latex]-5x^2+x-8[/latex]; all real numbers
[latex]5x^3-40x^2[/latex]; all real numbers
[latex]\frac{x-8}{5x^2}; \, x\ne 0[/latex]
[latex]-2x+6[/latex]; all real numbers
[latex]-2x^2+2x+12[/latex]; all real numbers
[latex]−x^4+2x^3+12x^2-18x-27[/latex]; all real numbers
[latex]-\frac{x+3}{x+1}; \, x\ne −1,3[/latex]
[latex]6+\frac{2}{x}; \, x\ne 0[/latex]
6; [latex]x\ne 0[/latex]
[latex]\frac{6}{x}+\frac{1}{x^2}; \, x\ne 0[/latex]
[latex]6x+1; \, x\ne 0[/latex]
[latex]4x+3[/latex]; all real numbers
[latex]4x+15[/latex]; all real numbers
[latex]x^4-6x^2+16[/latex]; all real numbers
[latex]x^4+14x^2+46[/latex]; all real numbers
[latex]\frac{3x}{4+x}; \, x\ne 0,-4[/latex]
[latex]\frac{4x+2}{3}; \, x\ne -\frac{1}{2}[/latex]
Yes, because there is only one winner for each year.
No, because there are three teams that won more than once during the years 2001 to 2012.
[latex]V(s)=s^3[/latex]
[latex]V(11.8)\approx 1643[/latex]; a cube of side length [latex]11.8[/latex] each has a volume of approximately [latex]1643[/latex] cubic units.
[latex]N(x)=15x[/latex]
i. [latex]N(20)=15(20)=300[/latex]; therefore, the vehicle can travel [latex]300[/latex] mi on a full tank of gas. ii. [latex]N(15)=225[/latex]; therefore, the vehicle can travel [latex]225[/latex] mi on [latex]3/4[/latex] of a tank of gas.
Domain: [latex]0\le x\le 20[/latex]; Range: [latex][0,300][/latex]
The driver had to stop at least once, given that it takes approximately [latex]39[/latex] gal of gas to drive a total of [latex]578[/latex] mi.
[latex]A(t)=A(r(t))=\pi ·(6-\frac{5}{t^2+1})^2[/latex]
Exact: [latex]\frac{121\pi }{4}[/latex]; approximately [latex]95[/latex] cm2
[latex]C(t)=C(r(t))=2\pi (6-\frac{5}{t^2+1})[/latex]
Exact: [latex]11\pi[/latex]; approximately [latex]35[/latex] cm
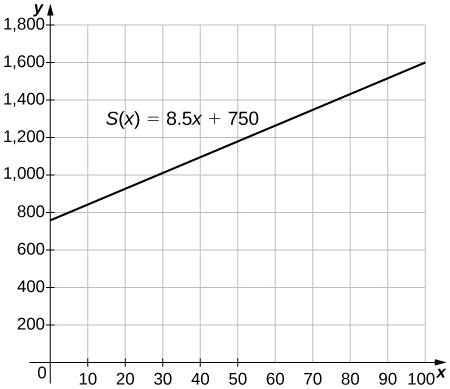
[latex]S(x)=8.5x+750[/latex]
[latex]$962.50[/latex], [latex]$1090[/latex], [latex]$1217.50[/latex]
[latex]77[/latex] skateboards
Basic Classes of Functions
[latex]−1[/latex]
Decreasing
[latex]3/4[/latex]
Increasing
[latex]4/3[/latex]
Increasing
[latex]0[/latex]
Horizontal
[latex]y=-6x+9[/latex]
[latex]y=\frac{1}{3}x+4[/latex]
[latex]y=\frac{1}{2}x[/latex]
[latex]y=\frac{3}{5}x-3[/latex]
[latex](m=2, \, b=-3)[/latex]
[latex](m=-6, \, b=0)[/latex]
[latex](m=0, \, b=-6)[/latex]
[latex](m=-\frac{2}{3}, \, b=2)[/latex]
[latex]2[/latex]
[latex]\frac{5}{2}, \, -1[/latex]
[latex]−5[/latex]
Both ends rise
Neither
[latex]2[/latex]
[latex]\pm \sqrt{2}[/latex]
[latex]−1[/latex]
Both ends rise
Even
[latex]3[/latex]
[latex]0[/latex], [latex]\pm \sqrt{3}[/latex]
[latex]0[/latex]
Left end rises, right end falls
Odd
[latex]13, \, -3, \, 5[/latex]
[latex]\frac{-3}{2}, \, \frac{-1}{2}, \, 4[/latex]
True, because [latex]n=3[/latex]
False, because [latex]f(x)=x^b[/latex] – where [latex]b[/latex] is a real-valued constant – is a power function. Exponential functions are of the form [latex]f(x)=b^x[/latex], where [latex]b[/latex] is a real-valued constant.
[latex]V(t)=-2733t+20500[/latex]
[latex](0, 20500)[/latex] means that the initial purchase price of the equipment is [latex]$20,500[/latex]; [latex](7.5,0)[/latex] means that in [latex]7.5[/latex] years the computer equipment has no value.
[latex]$6835[/latex]
In approximately [latex]6.4[/latex] years
[latex]C=0.75x+125[/latex]
[/latex]$245[latex]
[latex]167[/latex] cupcakes
[latex]V(t)=-1500t+26,000[/latex]
In [latex]4[/latex] years, the value of the car is [latex]$20,000[/latex].
[latex]$30,337.50[/latex]
[latex]96\%[/latex] of the total capacity
Previous/next navigation