- Calculate and interpret the slope of a linear function
Linear Functions
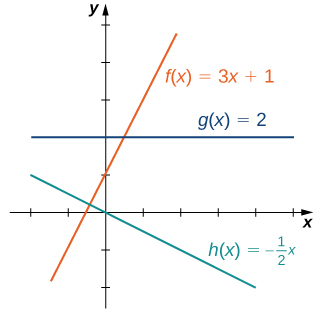
Linear functions have the form [latex]f(x)=ax+b[/latex], where [latex]a[/latex] and [latex]b[/latex] are constants. In Figure 1, we see examples of linear functions when [latex]a[/latex] is positive, negative, and zero. Note that if [latex]a>0[/latex], the graph of the line rises as [latex]x[/latex] increases. In other words, [latex]f(x)=ax+b[/latex] is increasing on [latex](−\infty, \infty)[/latex]. If [latex]a<0[/latex], the graph of the line falls as [latex]x[/latex] increases. In this case, [latex]f(x)=ax+b[/latex] is decreasing on [latex](−\infty, \infty)[/latex]. If [latex]a=0[/latex], the line is horizontal.
Slope
The graph of any linear function is a line. One of the distinguishing features of a line is its slope. The slope is the change in [latex]y[/latex] for each unit change in [latex]x[/latex]. The slope measures both the steepness and the direction of a line.
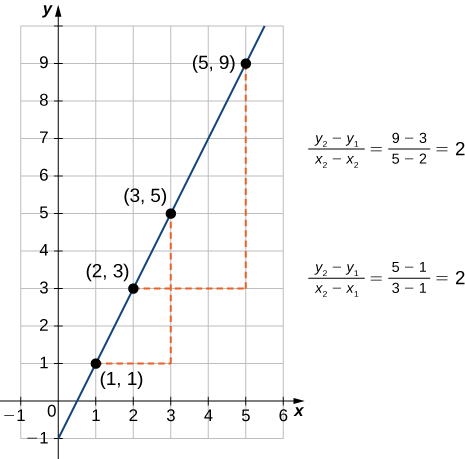
To calculate the slope of a line, we need to determine the ratio of the change in [latex]y[/latex] versus the change in [latex]x[/latex]. To do so, we choose any two points [latex](x_1,y_1)[/latex] and [latex](x_2,y_2)[/latex] on the line and calculate [latex]\dfrac{y_2-y_1}{x_2-x_1}[/latex]. In Figure 2, we see this ratio is independent of the points chosen.
slope of a linear line
Consider line [latex]L[/latex] passing through points [latex](x_1,y_1)[/latex] and [latex](x_2,y_2)[/latex]. Let [latex]\Delta y=y_2-y_1[/latex] and [latex]\Delta x=x_2-x_1[/latex] denote the changes in [latex]y[/latex] and [latex]x[/latex], respectively. The slope of the line is
If the slope is positive, the line points upward when moving from left to right. If the slope is negative, the line points downward when moving from left to right. If the slope is zero, the line is horizontal.
Slope-Intercept Form
The linear equation [latex]f(x)=ax+b[/latex] encapsulates two crucial pieces of information about its graph: the slope and the [latex]y[/latex]-intercept. The coefficient ‘[latex]a[/latex]‘ is the slope, dictating the angle and direction of the line, while ‘[latex]b[/latex]‘ gives us the [latex]y[/latex]-intercept, the point where the line crosses the [latex]y[/latex]-axis. This equation is the essence of the slope-intercept form, commonly written as [latex]f(x)=mx+b[/latex], with ‘[latex]m[/latex]‘ signifying the slope. It succinctly represents the linear function, offering a clear view of its gradient and starting point on a graph.
slope-intercept form
Consider a line with slope [latex]m[/latex] and [latex]y[/latex]-intercept [latex](0,b)[/latex]. The equation
is an equation for that line in slope-intercept form.
Consider the line passing through the points [latex](11,-4)[/latex] and [latex](-4,5)[/latex], as shown in Figure 3.
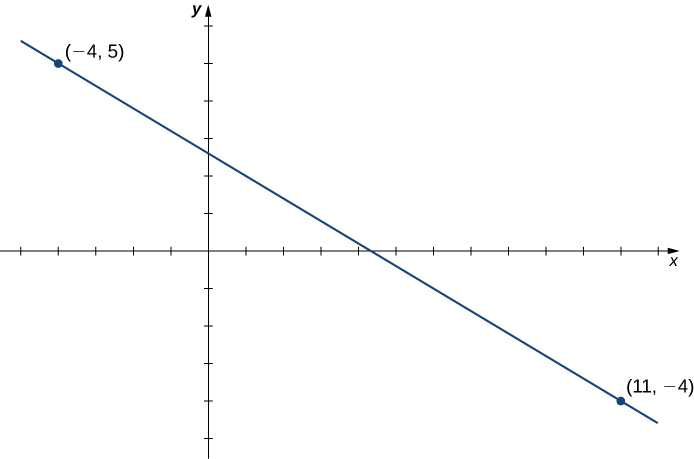
- Find the slope of the line.
- Find an equation for this linear function in slope-intercept form.
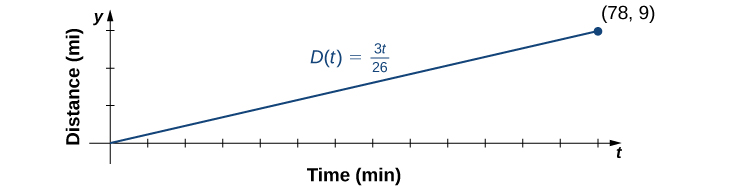
Aisha leaves her house at 5:50 a.m. and goes for a [latex]9[/latex]-mile run. She returns to her house at 7:08 a.m. Answer the following questions, assuming Aisha runs at a constant pace.
- Describe the distance [latex]D[/latex] (in miles) Aisha runs as a linear function of her run time [latex]t[/latex] (in minutes).
- Sketch a graph of [latex]D[/latex].
- Interpret the meaning of the slope.