Areas Between Curves
- [latex]\frac{32}{3}[/latex]
- [latex]\frac{13}{12}[/latex]
- [latex]36[/latex]
 [latex]243[/latex] square units
 [latex]4[/latex]
 [latex]\frac{2{(e-1)}^{2}}{e}[/latex]
 [latex]\frac{1}{3}[/latex]
 [latex]\frac{34}{3}[/latex]
 [latex]\frac{5}{2}[/latex]
 [latex]\frac{1}{2}[/latex]
 [latex]\frac{9}{2}[/latex]
 [latex]\frac{9}{2}[/latex]
 [latex]\frac{3\sqrt{3}}{2}[/latex]
 [latex]{e}^{-2}[/latex]
 [latex]\frac{27}{4}[/latex]
 [latex]\frac{4}{3}-\text{ln}(3)[/latex]
 [latex]\frac{1}{2}[/latex]
 [latex]\frac{1}{2}[/latex]
 [latex]-2(\sqrt{2}-\pi )[/latex]
- [latex]1.067[/latex]
- [latex]0.852[/latex]
- [latex]7.523[/latex]
- [latex]\frac{3\pi -4}{12}[/latex]
- [latex]1.429[/latex]
- [latex]$33,333.33[/latex] total profit for [latex]200[/latex] cell phones sold
- [latex]3.263[/latex] mi represents how far ahead the hare is from the tortoise
- [latex]\frac{343}{24}[/latex]
- [latex]4\sqrt{3}[/latex]
- [latex]\pi -\frac{32}{25}[/latex]
Determining Volumes by Slicing
- [latex]8[/latex] units3
- [latex]\frac{32}{3\sqrt{2}}[/latex] units3
- [latex]\frac{7\pi }{12}h{r}^{2}[/latex] units3
 [latex]\frac{\pi }{24}[/latex] units3
 [latex]2[/latex] units3
 [latex]\frac{\pi }{240}[/latex] units3
 [latex]\frac{4096\pi }{5}[/latex] units3
 [latex]\frac{8\pi }{9}[/latex] units3
 [latex]\frac{\pi }{2}[/latex] units3
 [latex]207\pi[/latex] units3
- [latex]y=2{x}^{3},x=0,x=1,\text{ and }y=0[/latex]
 [latex]\frac{4\pi }{5}[/latex] units3
  [latex]\frac{16\pi }{3}[/latex] units3
 [latex]\pi[/latex] units3
 [latex]\frac{16\pi }{3}[/latex] units3
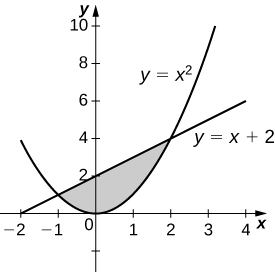 [latex]\frac{72\pi }{5}[/latex] units3
 [latex]\frac{108\pi }{5}[/latex] units3
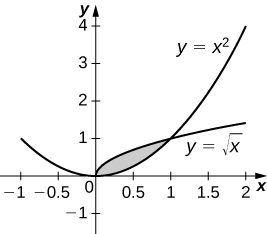 [latex]\frac{3\pi }{10}[/latex] units3
 [latex]2\sqrt{6}\pi[/latex] units3
 [latex]9\pi[/latex] units3
 [latex]\frac{\pi }{20}(75-4{\text{ln}}^{5}(2))[/latex] units3
- [latex]\frac{{m}^{2}\pi }{3}({b}^{3}-{a}^{3})[/latex] units3
- [latex]\frac{4{a}^{2}b\pi }{3}[/latex] units3
- [latex]2{\pi }^{2}[/latex] units3
- T[latex]\frac{2a{b}^{2}\pi }{3}[/latex] units3
- [latex]\frac{\pi }{12}{(r+h)}^{2}(6r-h)[/latex] units3
- [latex]\frac{\pi }{3}(h+R){(h-2R)}^{2}[/latex] units3
Volumes of Revolution: Cylindrical Shells

-
3
-
 [latex]81\pi[/latex] units3
 [latex]\frac{512\pi }{7}[/latex] units3
- [latex]2\pi[/latex] units3
- [latex]\frac{2\pi }{3}[/latex] units3
- [latex]2\pi[/latex] units3
- [latex]\frac{4\pi }{5}[/latex] units3
- [latex]\frac{64\pi }{3}[/latex] units3
- [latex]\frac{32\pi }{5}[/latex] units3
- [latex]\pi (e-2)[/latex] units3
- [latex]\frac{28\pi }{3}[/latex] units3
- [latex]\frac{-84\pi }{5}[/latex] units3
- [latex]\text{−}{e}^{\pi }{\pi }^{2}[/latex] units3
- [latex]\frac{64\pi }{5}[/latex] units3
- [latex]\frac{28\pi }{15}[/latex] units3
- [latex]\frac{3\pi }{10}[/latex] units3
- [latex]\frac{52\pi }{5}[/latex] units3
- [latex]0.9876[/latex] units3
 [latex]3\sqrt{2}[/latex] units3
 [latex]\frac{496\pi }{15}[/latex] units3
 [latex]\frac{398\pi }{15}[/latex] units3
 [latex]15.9074[/latex] units3
- [latex]\frac{1}{3}\pi {r}^{2}h[/latex] units3
- [latex]\pi {r}^{2}h[/latex] units3
Arc Length of a Curve and Surface Area
- [latex]2\sqrt{26}[/latex]
- [latex]2\sqrt{17}[/latex]
- [latex]\frac{13\sqrt{13}-8}{27}[/latex]
- [latex]\frac{4}{3}[/latex]
- [latex]2.0035[/latex]
- [latex]\frac{123}{32}[/latex]
- [latex]10[/latex]
- [latex]\frac{20}{3}[/latex]
- [latex]\frac{1}{675}(229\sqrt{229}-8)[/latex]
- [latex]\frac{1}{8}(4\sqrt{5}+\text{ln}(9+4\sqrt{5}))[/latex]
- [latex]1.201[/latex]
- [latex]15.2341[/latex]
- [latex]\frac{49\pi }{3}[/latex]
- [latex]70\pi \sqrt{2}[/latex]
- [latex]8\pi[/latex]
- [latex]120\pi \sqrt{26}[/latex]
- [latex]\frac{\pi }{6}(17\sqrt{17}-1)[/latex]
- [latex]9\sqrt{2}\pi[/latex]
- [latex]\frac{10\sqrt{10}\pi }{27}(73\sqrt{73}-1)[/latex]
- [latex]25.645[/latex]
- [latex]2\pi[/latex] /li>
- [latex]10.5017[/latex]
- [latex]23[/latex] ft
- [latex]2[/latex]
- Answers may vary