- Recognize key features of a parabola’s graph: vertex, axis of symmetry, y-intercept, and minimum or maximum value
Key Features of a Parabola’s Graph
The graph of a quadratic function is a U-shaped curve called a parabola. Some key features of a parabola are:
- Vertex: The extreme point of the parabola.
- Minimum Value: Vertex is the lowest point (parabola opens upwards).
- Maximum Value: Vertex is the highest point (parabola opens downwards).
- Axis of Symmetry: A vertical line through the vertex dividing the parabola into two mirror images.
- Intercepts:
- Y-intercept: Point where the graph crosses the [latex]y[/latex]-axis.
- X-intercepts: Points where the graph crosses the [latex]x[/latex]-axis (zeros or roots of the quadratic function).
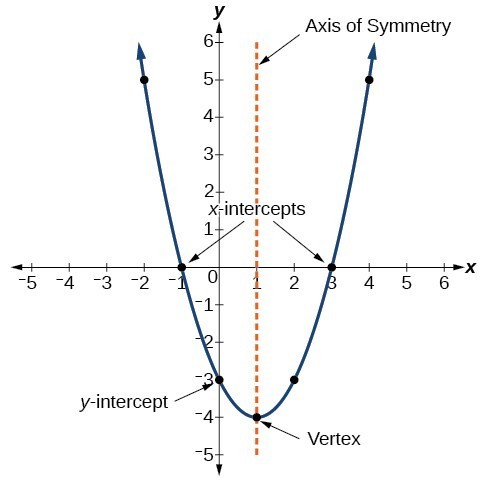
key features of a parabola
- Vertex: The highest or lowest point, indicating a maximum or minimum value.
- Axis of Symmetry: A vertical line that divides the parabola into two symmetric parts.
- Intercepts:
- Y-intercept: The point where the parabola crosses the [latex]y[/latex]-axis.
- X-intercepts: The points where the parabola crosses the [latex]x[/latex]-axis, representing the roots of the quadratic equation.
The places where a function’s graph crosses the horizontal axis are the places where the function value equals zero. These values are called meaning names such as horizontal intercepts, [latex]x[/latex]-intercepts, or the zeros of the graph. They can also be referred to as the roots of a function.
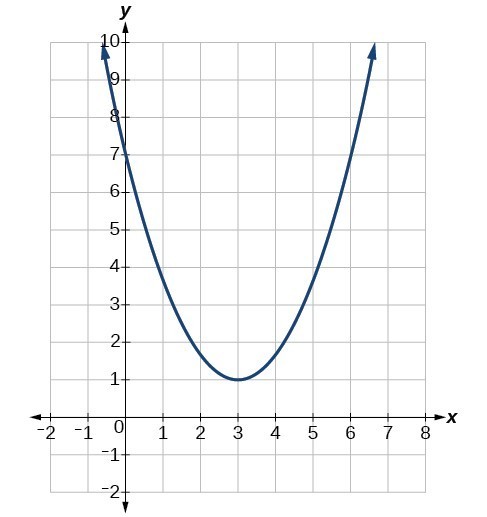
Determine the vertex, axis of symmetry, zeros, and [latex]y[/latex]-intercept of the parabola shown below.