- Understand how to write the limit of a function using the correct symbols and estimate limits by examining tables and graphs
- Understand one-sided limits (approaching a point from only one direction) and how they relate to two-sided limits
- Understand and use the proper notation for infinite limits and define vertical asymptotes
The Definition of a Limit
We begin our exploration of limits by taking a look at the graphs of the functions
which are shown in Figure 1. In particular, let’s focus our attention on the behavior of each graph at and around [latex]x=2[/latex].
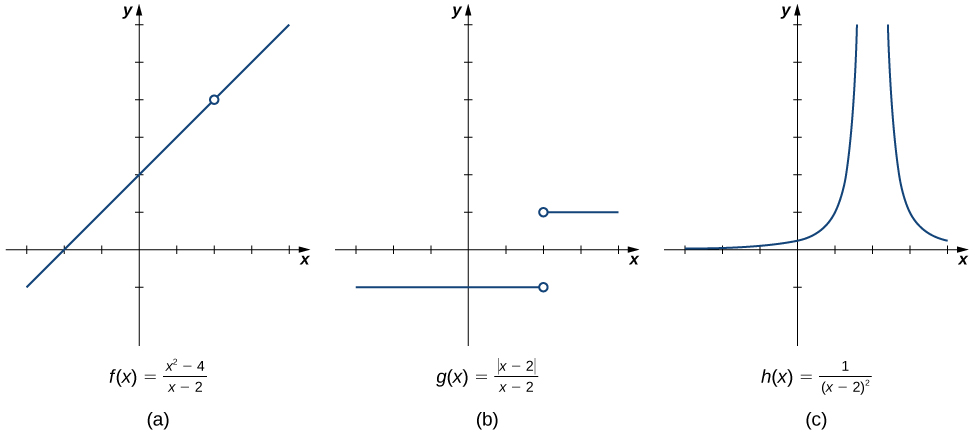
Each of the three functions is undefined at [latex]x=2[/latex], but if we make this statement and no other, we give a very incomplete picture of how each function behaves in the vicinity of [latex]x=2[/latex]. To express the behavior of each graph in the vicinity of [latex]2[/latex] more completely, we need to introduce the concept of a limit.
Intuitive Definition of a Limit
Let’s examine how the function [latex]f(x)=\dfrac{(x^2-4)}{(x-2)}[/latex] behaves as f [latex]x[/latex] approachs [latex]2[/latex]. While [latex]f(x)[/latex] isn’t defined at [latex]x=2[/latex], as [latex]x[/latex] gets closer to [latex]2[/latex] from either side, [latex]f(x)[/latex] approaches [latex]4[/latex].
Mathematically, we say that the limit of [latex]f(x)[/latex] as [latex]x[/latex] approaches [latex]2[/latex] is [latex]4[/latex]. We express this observation using limit notation as:
This initial exploration into limits leads us to a more formal definition.
Consider the limit of a function at a specific point as the value that the function’s output gets closer to, as the input values approach that point. Assuming such a value exists, we can articulate this concept more precisely with the following definition:
limit definition
For a function [latex]f(x)[/latex] defined over an open interval around a point [latex]a[/latex], possibly excluding [latex]a[/latex] itself, if all function values [latex]f(x)[/latex] get arbitrarily close to some real number [latex]L[/latex] as [latex]x[/latex] approaches [latex]a[/latex], then [latex]L[/latex] is the limit of [latex]f(x)[/latex] as [latex]x[/latex] approaches [latex]a[/latex].
A more succinct way to understand this definition: As [latex]x[/latex] gets closer to [latex]a[/latex], [latex]f(x)[/latex] gets closer and stays close to [latex]L[/latex].
Estimating Limits Using Tables
We can estimate limits by constructing tables of functional values.
How to: Evaluate a Limit Using a Table of Functional Values
- To find [latex]\underset{x\to a}{\lim}f(x)[/latex], create a table with two sets of [latex]x[/latex]-values: those just less than [latex]a[/latex] and those just more than [latex]a[/latex]. The table below demonstrates what your tables might look like.
Table of Functional Values for [latex]\underset{x\to a}{\lim}f(x)[/latex] [latex]x[/latex] [latex]f(x)[/latex] [latex]x[/latex] [latex]f(x)[/latex] [latex]a-0.1[/latex] [latex]f(a-0.1)[/latex] [latex]a+0.1[/latex] [latex]f(a+0.1)[/latex] [latex]a-0.01[/latex] [latex]f(a-0.01)[/latex] [latex]a+0.01[/latex] [latex]f(a+0.01)[/latex] [latex]a-0.001[/latex] [latex]f(a-0.001)[/latex] [latex]a+0.001[/latex] [latex]f(a+0.001)[/latex] [latex]a-0.0001[/latex] [latex]f(a-0.0001)[/latex] [latex]a+0.0001[/latex] [latex]f(a+0.0001)[/latex] Use additional values as necessary. Use additional values as necessary. - Analyze the [latex]f(x)[/latex] values. If they get closer to a single number as [latex]x[/latex] approaches [latex]a[/latex] from both sides, that’s the limit.
- If both sides of [latex]f(x)[/latex] is confirmed. If not, the limit may not exist.
- Use the graph of [latex]f(x)[/latex] to verify your results. By plotting the function and zooming in around [latex]x=a[/latex], you can observe if [latex]f(x)[/latex] approaches the limit you calculated. This visual check complements the numerical approach.
Evaluate [latex]\underset{x\to 4}{\lim}\dfrac{\sqrt{x}-2}{x-4}[/latex] using a table of functional values.
![A graph of the function f(x) = (sqrt(x) – 2 ) / (x-4) over the interval [0,8]. There is an open circle on the function at x=4. The function curves asymptotically towards the x axis and y axis in quadrant one.](https://s3-us-west-2.amazonaws.com/courses-images/wp-content/uploads/sites/2332/2018/01/11202855/CNX_Calc_Figure_02_02_004.jpg)